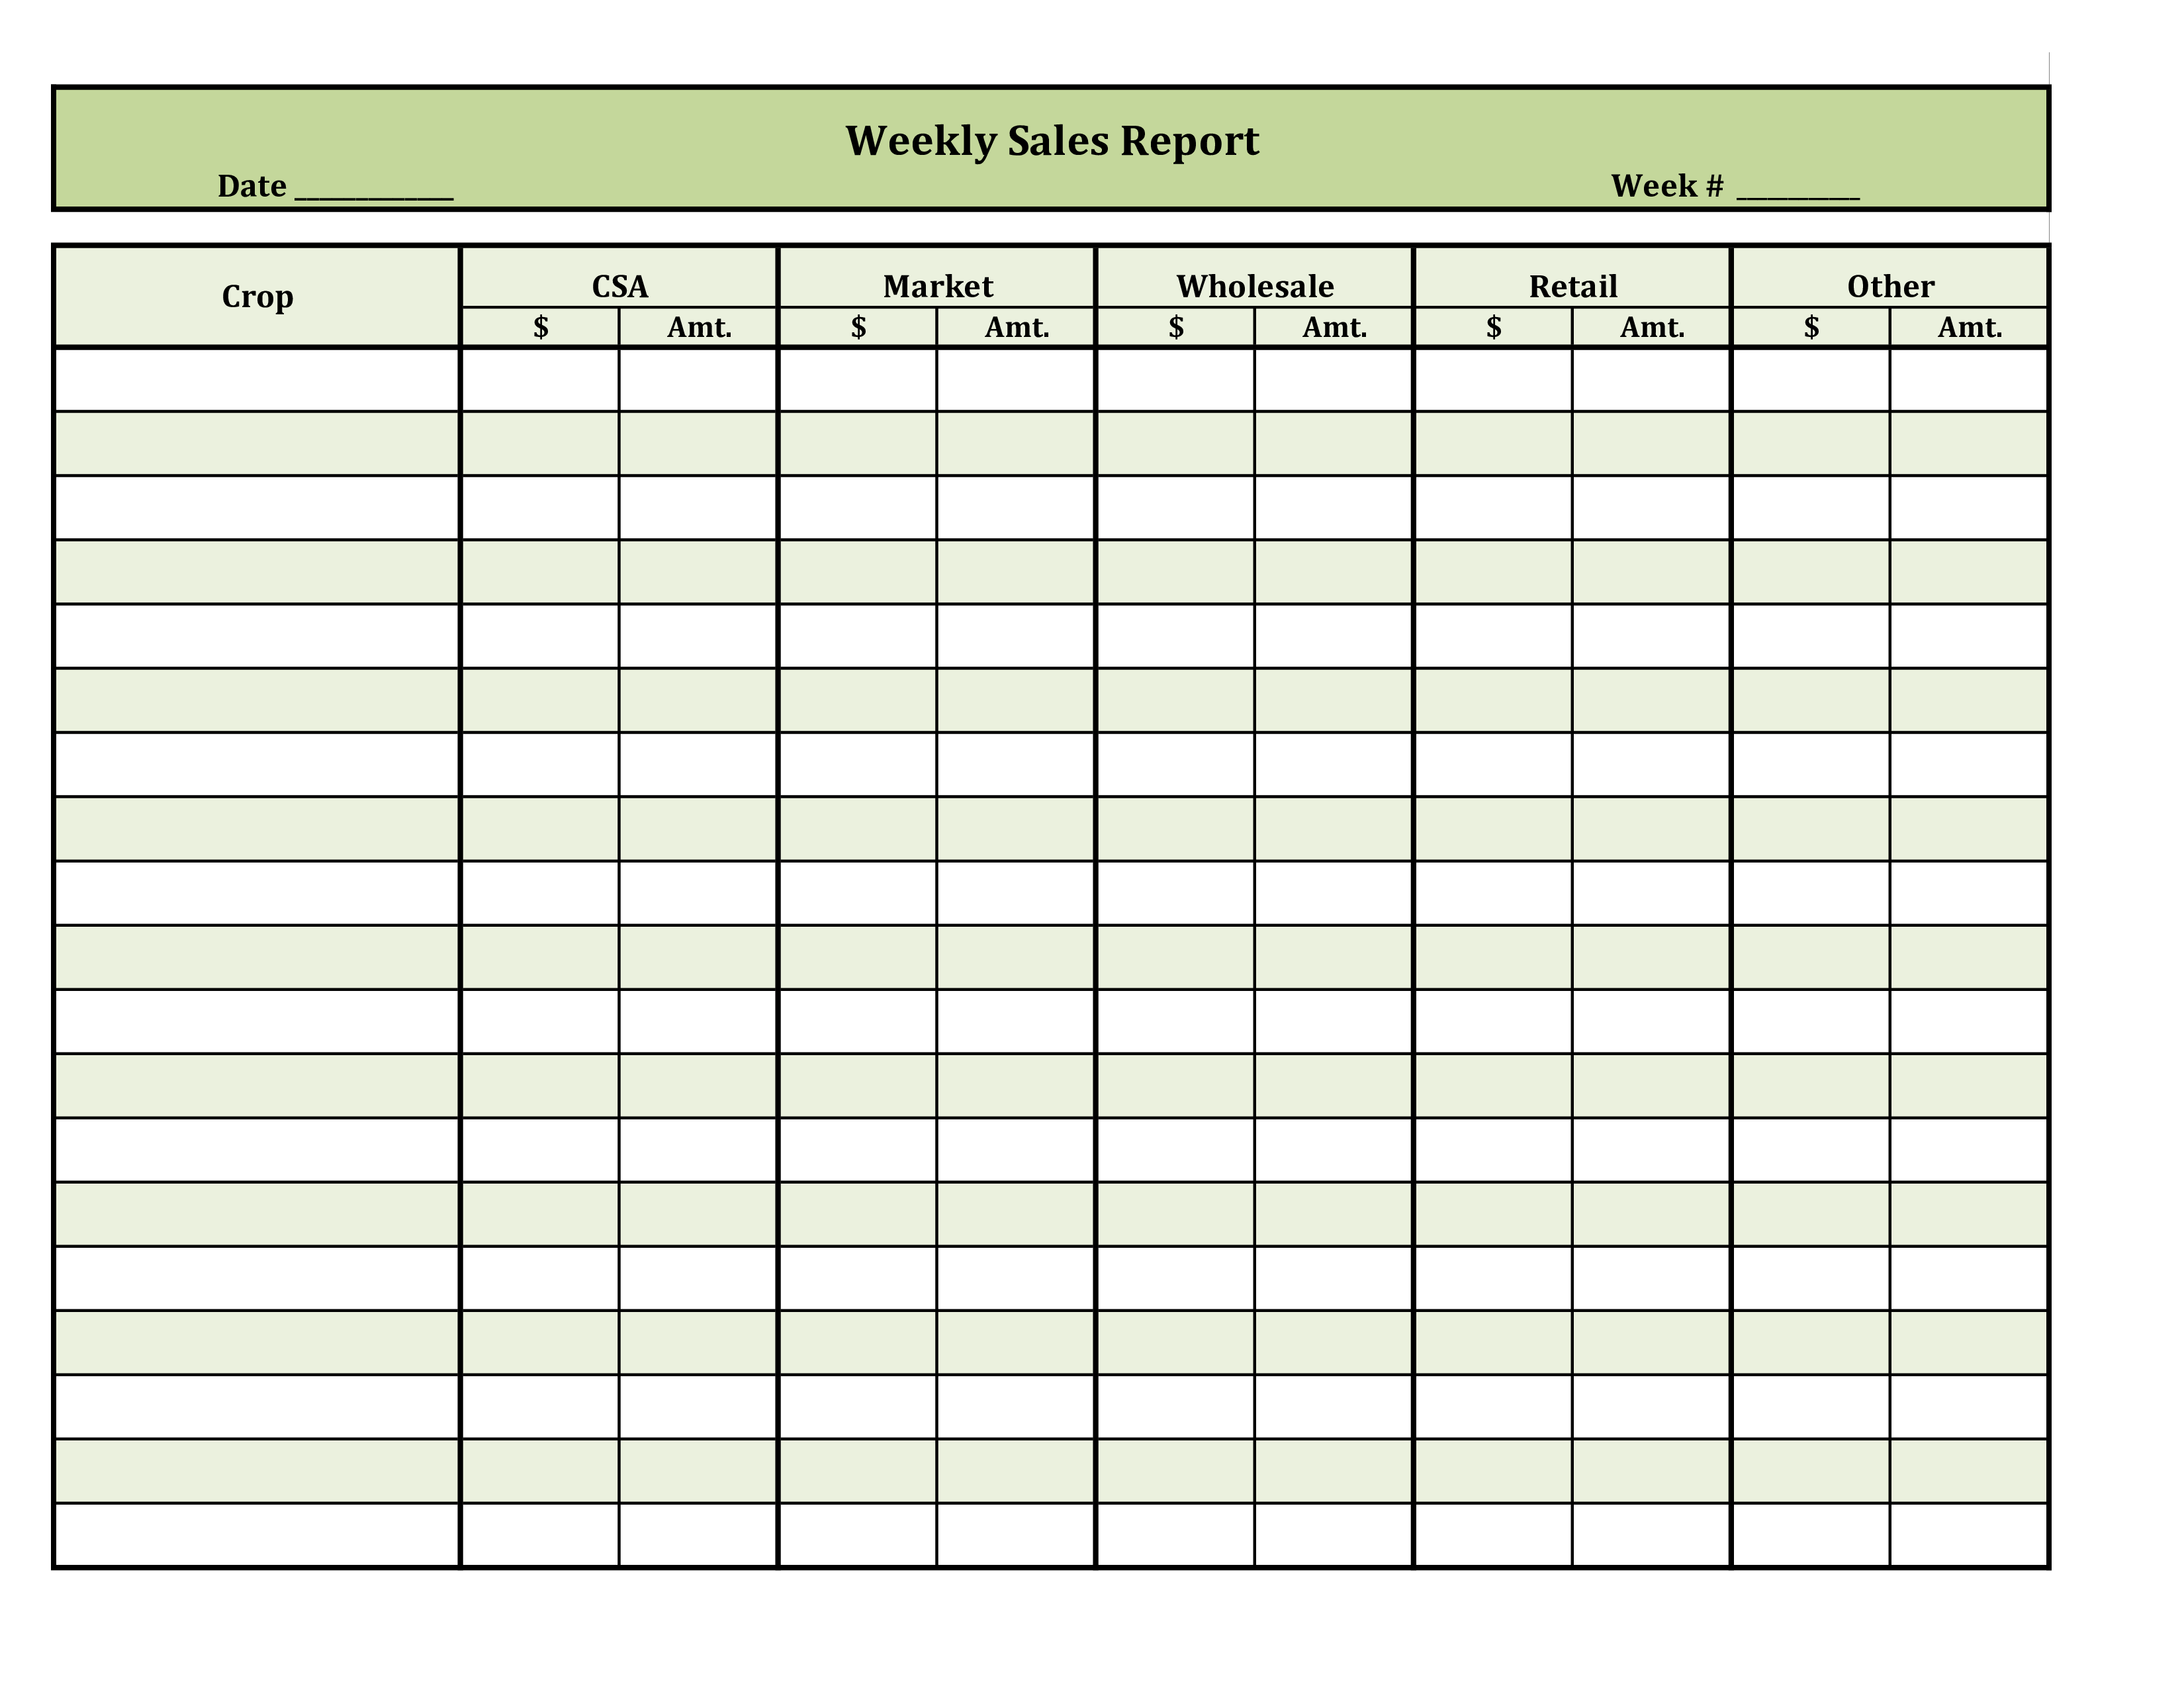
In today’s competitive business landscape, it is crucial for organizations to track and analyze their sales performance. Sales reports provide valuable insights into a company’s sales activities, helping businesses make informed decisions to improve their sales strategies, identify areas for growth, and optimize their overall performance.
What is a Sales Report?
A sales report is a document that presents data and information about a company’s sales activities over a specific period. It typically includes details such as the number of units sold, revenue generated, customer acquisition and retention rates, and other key performance indicators (KPIs).
By regularly generating and analyzing sales reports, businesses can gain a comprehensive understanding of their sales performance, identify trends, and make data-driven decisions to drive growth.
The Importance of Sales Reports
Sales reports play a vital role in helping businesses measure and evaluate their sales performance. Here are some reasons why sales reports are essential:
- Performance Evaluation: Sales reports allow organizations to assess their sales team’s performance, identify top-performing representatives, and recognize areas for improvement.
- Goal Tracking: By comparing actual sales figures against sales targets, businesses can track their progress and take corrective actions if necessary.
- Identifying Trends: Sales reports provide valuable insights into market trends, customer preferences, and product performance, enabling businesses to adapt their strategies accordingly.
- Budgeting and Forecasting: Analyzing sales reports helps organizations forecast future sales, set realistic budgets, and allocate resources effectively.
- Optimizing Sales Strategies: Sales reports provide valuable data to refine sales strategies, identify effective tactics, and allocate resources to maximize sales performance.
Types of Sales Reports
There are various types of sales reports that businesses can generate to gain specific insights into their sales performance. Let’s explore some commonly used sales reports:
1. Sales Performance Report
A sales performance report provides an overview of a company’s sales activities, including revenue generated, units sold, and other KPIs. It helps businesses assess their overall sales performance and identify areas for improvement.
2. Sales by Region Report
This report breaks down sales figures by geographic regions, allowing businesses to identify high-performing regions and allocate resources accordingly. It also helps businesses understand regional market dynamics and customer preferences.
3. Sales by Product Report
A sales by product report provides insights into the performance of individual products or product categories. It helps businesses identify top-selling products, assess product profitability, and make informed decisions about product development and marketing strategies.
4. Sales by Customer Report
This report categorizes sales data based on customer segments, such as new customers, repeat customers, or customer types. It helps businesses understand their customer base, identify loyal customers, and tailor marketing and sales strategies to specific customer segments.
5. Sales Funnel Analysis Report
A sales funnel analysis report tracks the progress of potential customers through various stages of the sales process. It helps businesses identify bottlenecks, optimize the conversion rate, and improve sales funnel efficiency.
Benefits of Using Sales Report Templates
Creating sales reports from scratch can be time-consuming and complex. Sales report templates offer a convenient and efficient solution for businesses to streamline their sales analysis efforts. Here are some benefits of using sales report templates:
- Time-Saving: Templates provide a pre-designed structure that saves time and effort in creating sales reports from scratch.
- Consistency: Templates ensure consistent formatting and presentation of sales reports across different periods and departments.
- Efficiency: Sales report templates often come with built-in formulas and calculations, automating data analysis and reducing errors.
- Customizability: Templates can be customized to fit specific business needs and incorporate relevant KPIs and metrics.
- Professional Appearance: Well-designed templates enhance the visual appeal of sales reports, making them easier to interpret and understand.
Key Elements of an Effective Sales Report Template
An effective sales report template should include the following key elements:
1. Header and Company Logo
The header of the sales report template should prominently display the company’s name, logo, and report title. This provides a professional and branded appearance to the report.
2. Report Period
Clearly indicate the time period covered by the sales report. This allows readers to understand the context of the data and compare it with previous or future periods.
3. Executive Summary
Include an executive summary at the beginning of the report, providing a concise overview of the key findings and insights. This section should highlight the most important information and key performance indicators.
4. Visual Representations
Use charts, graphs, and tables to present sales data visually. Visual representations make it easier for readers to understand complex data and identify trends or patterns.
5. Key Performance Indicators
Include relevant KPIs such as revenue, units sold, customer acquisition and retention rates, conversion rates, and average order value. These metrics provide insights into the overall sales performance and help track progress towards goals.
6. Comparative Analysis
Compare current sales figures with previous periods or sales targets to provide context and assess performance. This analysis can be presented through tables or charts.
7. Detailed Breakdowns
Include detailed breakdowns of sales figures by product, region, customer segment, or any other relevant category. This allows for a more granular analysis and identification of specific areas for improvement.
8. Recommendations and Action Plan
Based on the analysis of sales data, provide recommendations and an action plan to address any identified issues or capitalize on opportunities. This section should outline specific steps to improve sales performance.
Best Practices for Creating Sales Reports
Follow these best practices to create effective and insightful sales reports:
- Define Clear Objectives: Clearly define the objectives and purpose of the sales report to ensure that it aligns with the overall business goals.
- Collect Accurate and Relevant Data: Use reliable data sources and collect accurate and up-to-date information to ensure the integrity of the sales report.
- Focus on Key Metrics: Include key metrics and KPIs that provide meaningful insights into the sales performance. Avoid overwhelming the report with unnecessary data.
- Provide Context: Add contextual information such as market trends, competitive analysis, or industry benchmarks to help readers interpret the sales data effectively.
- Use Visual Representations: Utilize charts, graphs, and tables to present data visually and make it easier for readers to understand complex information.
- Keep it Concise: Present information in a clear and concise manner, avoiding unnecessary jargon or excessive details that may distract or confuse readers.
- Regularly Update and Review: Keep sales reports up-to-date and review them regularly to track progress, identify trends, and make informed decisions.
Conclusion
Sales reports are powerful tools that enable businesses to monitor their sales performance, identify areas for improvement, and make data-driven decisions. By utilizing sales report templates and following best practices, organizations can streamline their sales analysis efforts and gain valuable insights to drive growth and success.
FAQs After The Conclusion:
1. How often should sales reports be generated?
Sales reports should be generated regularly, depending on the specific needs of the business. Monthly or quarterly reports are common, but some companies may require weekly or even daily reports for real-time analysis.
2. What software can be used to create sales reports?
There are several software options available for creating sales reports, including Microsoft Excel, Google Sheets, CRM software with built-in reporting features, and dedicated business intelligence tools.
3. How can sales reports help in sales forecasting?
Sales reports provide historical sales data that can be used to identify trends, patterns, and seasonality. By analyzing this data, businesses can make informed predictions and forecasts about future sales performance.
4. Can sales reports be used to evaluate individual sales team members?
Yes, sales reports can be used to assess individual sales team members’ performance by tracking metrics such as sales revenue, conversion rates, and customer acquisition. This evaluation helps identify top performers and areas for improvement.
5. Are sales reports only relevant for large businesses?
No, sales reports are valuable for businesses of all sizes. Small and medium-sized enterprises can benefit from sales reports by gaining insights into their sales performance, identifying growth opportunities, and making data-driven decisions to drive success.
Strong Summary:
Sales report templates are valuable tools for businesses to streamline their sales analysis efforts and gain valuable insights into their sales performance. By regularly generating and analyzing sales reports, companies can evaluate their sales team’s performance, track progress towards goals, identify trends, and make data-driven decisions to optimize their sales strategies. There are various types of sales reports that businesses can generate, including sales performance reports, sales by region reports, sales by product reports, sales by customer reports, and sales funnel analysis reports. Using sales report templates offers several benefits, such as time-saving, consistency, efficiency, customizability, and a professional appearance. An effective sales report template should include key elements such as a header and company logo, the report period, an executive summary, visual representations, key performance indicators, comparative analysis, detailed breakdowns, and recommendations and an action plan. Following best practices, such as defining clear objectives, collecting accurate and relevant data, focusing on key metrics, providing context, using visual representations, keeping it concise, and regularly updating and reviewing the reports, will ensure the creation of insightful and effective sales reports. Sales reports are not only relevant for large businesses but also for small and medium-sized enterprises, as they provide valuable insights and help drive growth and success. By utilizing sales report templates and following best practices, businesses can gain a competitive edge and make informed decisions to optimize their sales performance.
FAQs After The Conclusion:
1. How often should sales reports be generated?
Sales reports should be generated regularly, depending on the specific needs of the business. Monthly or quarterly reports are common, but some companies may require weekly or even daily reports for real-time analysis.
2. What software can be used to create sales reports?
There are several software options available for creating sales reports, including Microsoft Excel, Google Sheets, CRM software with built-in reporting features, and dedicated business intelligence tools.
3. How can sales reports help in sales forecasting?
Sales reports provide historical sales data that can be used to identify trends, patterns, and seasonality. By analyzing this data, businesses can make informed predictions and forecasts about future sales performance.
4. Can sales reports be used to evaluate individual sales team members?
Yes, sales reports can be used to assess individual sales team members’ performance by tracking metrics such as sales revenue, conversion rates, and customer acquisition. This evaluation helps identify top performers and areas for improvement.
5. Are sales reports only relevant for large businesses?
No, sales reports are valuable for businesses of all sizes. Small and medium-sized enterprises can benefit from sales reports by gaining insights into their sales performance, identifying growth opportunities, and making data-driven decisions to drive success.
In conclusion, sales report templates are essential tools for businesses to effectively track and analyze their sales performance. These templates provide a structured framework for generating sales reports, saving time and effort. By utilizing sales report templates and following best practices, businesses can gain valuable insights, identify areas for improvement, and make informed decisions to optimize their sales strategies. Sales reports are not only relevant for large organizations but also for small and medium-sized enterprises, as they provide valuable data to drive growth and success. By incorporating sales report templates into their analysis processes, businesses can enhance their sales performance and gain a competitive edge in the market.


