Keeping track of your expenses is a crucial aspect of financial management. Whether you are an individual trying to budget your personal expenses or a business owner monitoring company expenditures, an Excel expenses report can be your best ally. With its versatility and user-friendly features, Excel allows you to efficiently organize, analyze, and visualize your financial data. In this article, we will explore the benefits of using Excel for expense reporting, provide step-by-step instructions on creating an Excel expenses report, and share some valuable tips and tricks to optimize your financial management process.
Table of Contents
- Why Use Excel for Expense Reporting?
- Step-by-Step Guide to Creating an Excel Expenses Report
- Tips for Optimizing Your Excel Expenses Report
- Case Study: How Company XYZ Streamlined Expense Tracking with Excel
- Common Challenges and Solutions in Expense Reporting
- Conclusion
- FAQs
Why Use Excel for Expense Reporting?
Excel is a widely recognized and widely used spreadsheet software that offers numerous advantages for expense reporting. Here are some compelling reasons why you should consider using Excel:
1. Versatility and Customization
Excel provides you with a blank canvas where you can tailor your expense report according to your specific needs. You have complete control over the layout, formatting, and formulas you use. Whether you prefer a simple table or a more complex report with graphs and charts, Excel can accommodate your preferences.
2. Calculation and Analysis
Excel’s built-in formulas and functions allow you to perform complex calculations and analysis on your expense data. From summing up expenses to calculating averages and creating pivot tables for deeper insights, Excel provides a range of powerful tools to help you make sense of your financial information.
3. Automation and Efficiency
With Excel’s automation features, you can save time and effort by automating repetitive tasks. From automatically calculating totals to generating reports with a single click, Excel streamlines your expense reporting process and reduces the risk of human errors.
4. Data Visualization
Excel offers a variety of visualization options, including charts and graphs, to help you present your expense data in a visually appealing and easily understandable format. Visual representations can enhance your ability to spot trends, identify patterns, and communicate financial insights effectively.
5. Integration and Compatibility
Excel seamlessly integrates with other Microsoft Office applications, such as Word and PowerPoint, allowing you to transfer data and create professional reports or presentations. It is also compatible with various accounting software and online banking platforms, making it easy to import and export financial data.
Step-by-Step Guide to Creating an Excel Expenses Report
Now that you understand the benefits of using Excel for expense reporting, let’s dive into creating your own Excel expenses report. Follow these step-by-step instructions to get started:
Step 1: Define Your Expense Categories
Before you begin entering data into your Excel expenses report, it is essential to define your expense categories. Common expense categories include accommodation, transportation, meals, entertainment, utilities, and office supplies. Determine the categories that align with your specific needs and create a list of them in a separate sheet within your Excel workbook.
Step 2: Create a New Worksheet
To keep your expense report organized, it is advisable to create a new worksheet dedicated solely to your expenses. This will allow you to have a clean and focused view of your financial data. To create a new worksheet, click on the “+” button located at the bottom of your Excel window or use the “Insert” tab and select “Worksheet.”
Step 3: Set Up Your Expense Report Layout
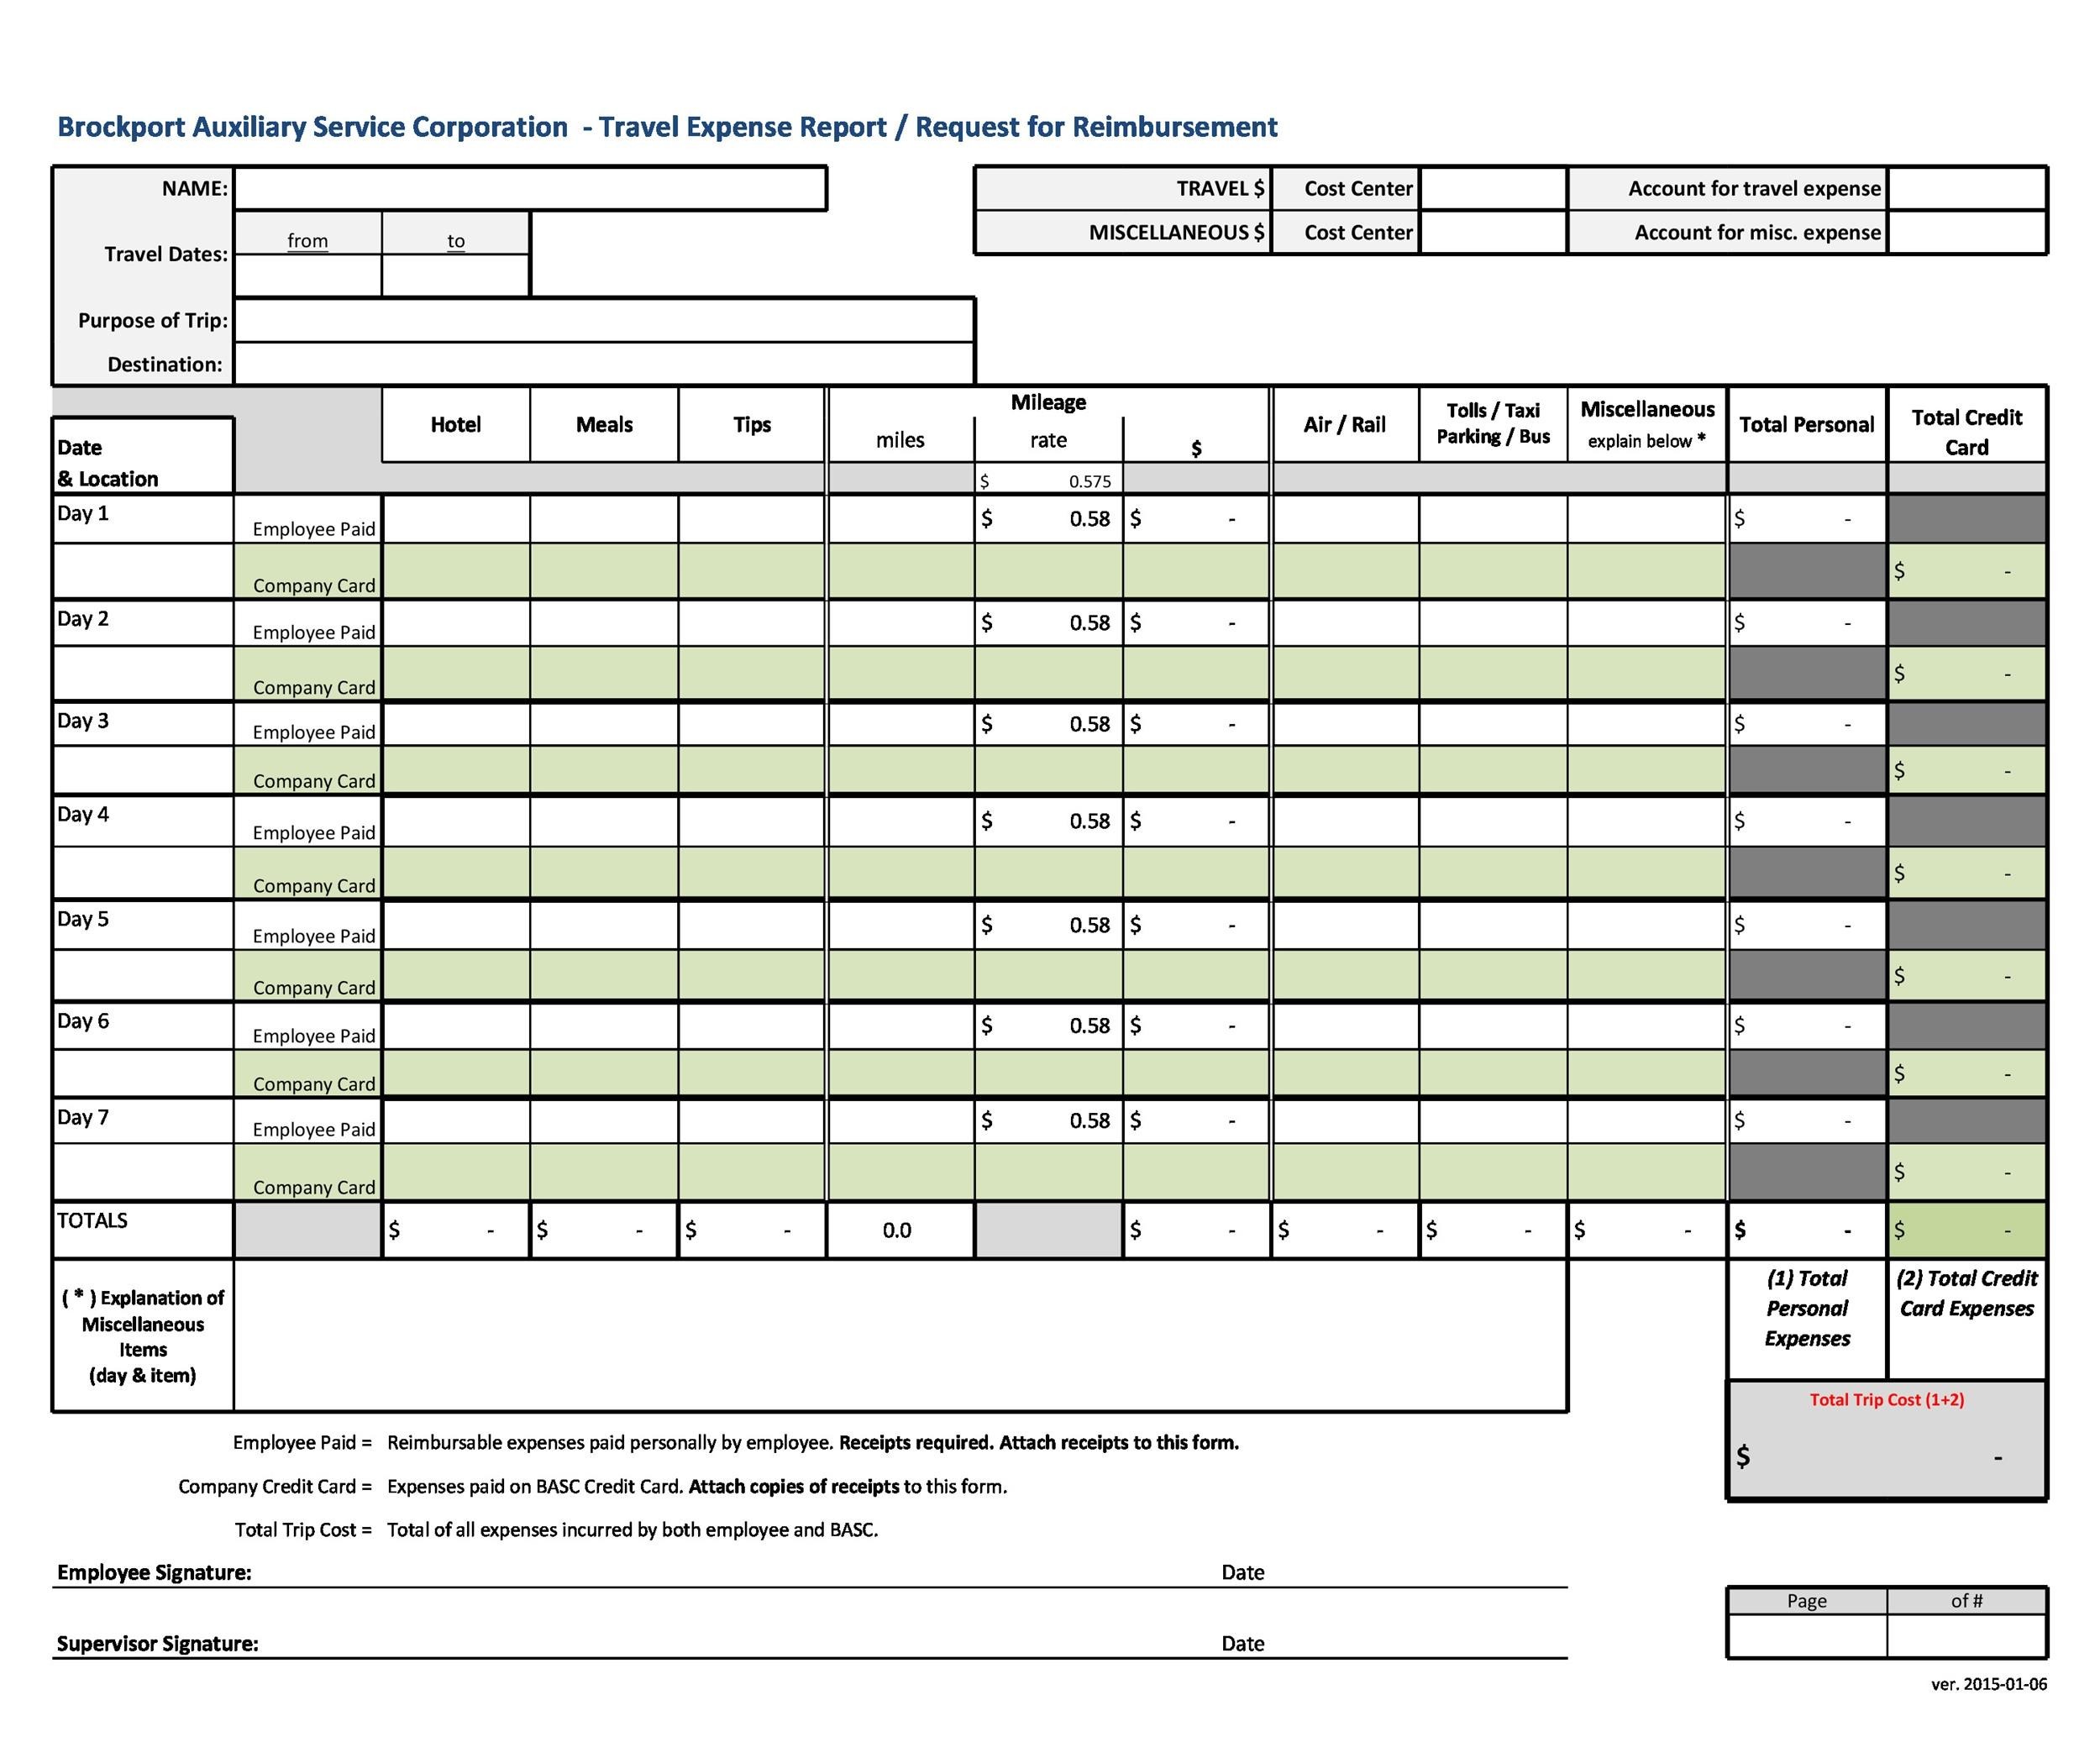
Decide on the layout of your expense report, considering the information you want to track. Typically, an expense report includes columns for the date, expense category, description, amount, and any additional notes. You can customize the column headers by merging cells, changing font styles, and applying formatting options.
Step 4: Enter Your Expense Data
Now it’s time to start entering your expense data into the respective columns. Begin with the date of the expense, followed by the expense category, description, and amount. If you have any additional notes or comments, create a separate column for them. Repeat this process for each expense you want to include in your report.
Step 5: Apply Formulas for Calculations
To automate calculations and obtain meaningful insights from your expense data, apply formulas to your report. For example, you can use the SUM function to calculate the total expenses, the AVERAGE function to determine the average expense per category, and the COUNT function to count the number of expenses recorded.
Step 6: Format and Style Your Report
Make your expense report visually appealing and easy to read by applying formatting and styling options. Use borders to separate sections, apply conditional formatting to highlight certain expense categories, and choose appropriate fonts and colors. Remember to align your data and headers consistently for a professional look.
Step 7: Create Charts and Graphs
To gain a better understanding of your expenses and communicate your findings effectively, consider creating charts and graphs based on your data. Excel offers various chart types, such as bar charts, pie charts, and line graphs. Choose the chart type that best represents your data and insert it into your report.
Step 8: Set Up Filters and Sorting Options
Filters and sorting options can help you analyze your expenses from different perspectives. Use Excel’s filtering capabilities to view specific expense categories, sort your data by date or amount, and apply conditional formatting to highlight outliers or specific criteria. This will allow you to delve deeper into your expense data and identify any patterns or discrepancies.
Step 9: Regularly Update and Review Your Expense Report
An Excel expenses report is not a one-time creation; it requires regular updates and reviews to reflect the latest financial information accurately. Set a schedule to update your report, whether it’s weekly, monthly, or quarterly. Make it a habit to review your expenses, spot any irregularities or trends, and adjust your budget accordingly.
Tips for Optimizing Your Excel Expenses Report
Now that you have created your Excel expenses report, here are some valuable tips to enhance its effectiveness:
1. Use Data Validation
Data validation ensures the accuracy and consistency of data entered into your expense report. You can create drop-down lists for expense categories, set limits for numerical values, and prevent users from entering invalid data. This feature reduces errors and maintains data integrity.
2. Utilize Conditional Formatting
Conditional formatting allows you to highlight specific cells or ranges based on predefined conditions. For example, you can use conditional formatting to highlight expenses that exceed a certain threshold or to color-code different expense categories. This visual representation helps you quickly identify important information.
3. Explore PivotTables and PivotCharts
PivotTables and PivotCharts are powerful tools in Excel that enable you to analyze and summarize large sets of data. You can create dynamic reports, filter data based on multiple criteria, and generate interactive charts that provide deeper insights into your expenses. Experiment with PivotTables and PivotCharts to discover new perspectives on your financial data.
4. Protect Your Worksheet
To prevent accidental changes or unauthorized access to your expense report, consider protecting your worksheet. Excel allows you to apply password protection, restrict editing permissions, and hide formulas or sensitive information. Safeguarding your report ensures the integrity and confidentiality of your financial data.
5. Back Up Your Excel File
Regularly back up your Excel expenses report to avoid any loss or corruption of data. You can save copies of your file on external storage devices, such as USB drives or cloud storage platforms. Additionally, consider using version control software to track changes and maintain a history of your expense reports.
Case Study: How Company XYZ Streamlined Expense Tracking with Excel
Company XYZ, a medium-sized technology company, faced challenges in tracking and managing employee expenses. They were using a manual process that involved collecting paper receipts and manually inputting data into a spreadsheet. This process was time-consuming, prone to errors, and lacked visibility into real-time spending.
To address these challenges, Company XYZ implemented an Excel expenses report system. They created a standardized expense report template using Excel and provided training to employees on how to use it effectively. The new system allowed employees to submit their expenses electronically, eliminating the need for paper receipts and manual data entry.
By using Excel’s features, such as formulas, filters, and charts, Company XYZ gained better insights into their spending patterns. They could easily track individual and departmental expenses, identify cost-saving opportunities
Case Study: How Company XYZ Streamlined Expense Tracking with Excel (Continued)
By using Excel’s features, such as formulas, filters, and charts, Company XYZ gained better insights into their spending patterns. They could easily track individual and departmental expenses, identify cost-saving opportunities, and make informed budgetary decisions.
The automation capabilities of Excel also improved the efficiency of the expense tracking process. Employees could enter their expenses directly into the Excel template, which automatically calculated totals and generated reports. This saved time, reduced errors, and allowed for faster reimbursement of expenses.
Furthermore, the visualizations created using Excel’s charts and graphs enhanced the communication of financial information. Company XYZ could present expense reports to stakeholders in a clear and concise manner, facilitating discussions around budgeting and resource allocation.
Overall, the implementation of Excel for expense tracking transformed Company XYZ’s financial management process. They experienced increased accuracy, efficiency, and transparency in their expense reporting, leading to better financial control and decision-making.
Common Challenges and Solutions in Expense Reporting
While Excel can greatly simplify expense reporting, there are still common challenges that individuals and organizations may face. Here are a few challenges and their potential solutions:
1. Manual Data Entry
Challenge: The process of manually entering expense data into Excel can be time-consuming and prone to errors.
Solution: Explore options for automating data entry, such as using OCR (Optical Character Recognition) technology to extract information from receipts or integrating Excel with expense management software that automatically populates data.
2. Missing Receipts
Challenge: Receipts are often lost or misplaced, making it difficult to accurately track and validate expenses.
Solution: Encourage employees to use digital receipt management tools or mobile apps that allow them to capture and store receipts electronically. This ensures that receipts are readily available and reduces the risk of losing important documents.
3. Lack of Expense Policy Compliance
Challenge: Employees may not adhere to expense policies, resulting in unauthorized or excessive spending.
Solution: Clearly communicate and reinforce expense policies to employees, providing them with training on proper expense reporting procedures. Regularly review and update the policies to address any evolving needs or challenges.
4. Inefficient Approval Processes
Challenge: Delays in the approval process can lead to delayed reimbursements and frustration among employees.
Solution: Implement an automated approval workflow within Excel or integrate with workflow management tools to streamline the approval process. This ensures that expense reports are reviewed and approved in a timely manner.
5. Limited Data Analysis
Challenge: Without proper data analysis, it can be challenging to identify trends, patterns, and areas for improvement in expense management.
Solution: Invest in training employees on Excel’s advanced features, such as pivot tables, data analysis tools, and macros. These tools enable deeper analysis of expense data and provide valuable insights for better decision-making.
Conclusion
An Excel expenses report is a powerful tool for managing your finances effectively. Its versatility, customization options, calculation capabilities, and data visualization features make it an ideal choice for individuals and businesses alike. By following the step-by-step guide outlined in this article and implementing the tips and tricks provided, you can create an efficient and informative expense report that enables better financial control, analysis, and decision-making.
FAQs
1. Can I use Excel for personal expense tracking?
Yes, Excel is an excellent tool for personal expense tracking. You can create a customized expense report to monitor your spending, set budgets, and analyze your financial habits.
2. Can I import bank statements into Excel for expense reporting?
Yes, Excel allows you to import data from various sources, including bank statements. By importing your bank statements into Excel, you can reconcile your expenses, categorize them, and gain a comprehensive view of your financial transactions.
3. Can I share my Excel expenses report with others?
Yes, you can easily share your Excel expenses report with others. Excel provides options to save your file in different formats, such as PDF or CSV, making it accessible to individuals who may not have Excel installed on their devices.
4. Is it possible to create multiple expense reports within one Excel file?
Yes, you can create multiple expense reports within a single Excel file by using different worksheets. Each worksheet can represent a separate report, allowing you to organize and manage your expenses efficiently.
5. Are there any alternatives to Excel for expense reporting?
While Excel is a popular choice for expense reporting, there are other software options available. Some alternatives include Google Sheets, QuickBooks, and specialized expense management software. It’s important to choose a tool that best suits your specific needs and preferences.
Summary
An Excel expenses report offers numerous benefits for individuals and businesses seeking to manage their finances effectively. With its versatility, customization options, calculation capabilities, and data visualization features, Excel serves as a powerful tool for tracking, analyzing, and reporting expenses. By following the step-by-step guide provided in this article, leveraging the tips and tricks, and addressing common challenges, you can create a comprehensive and well-organized expense report. Excel empowers you to make informed financial decisions, optimize your budget, and gain valuable insights into your spending habits. Embrace the power of Excel for expense reporting and take control of your financial management process.


