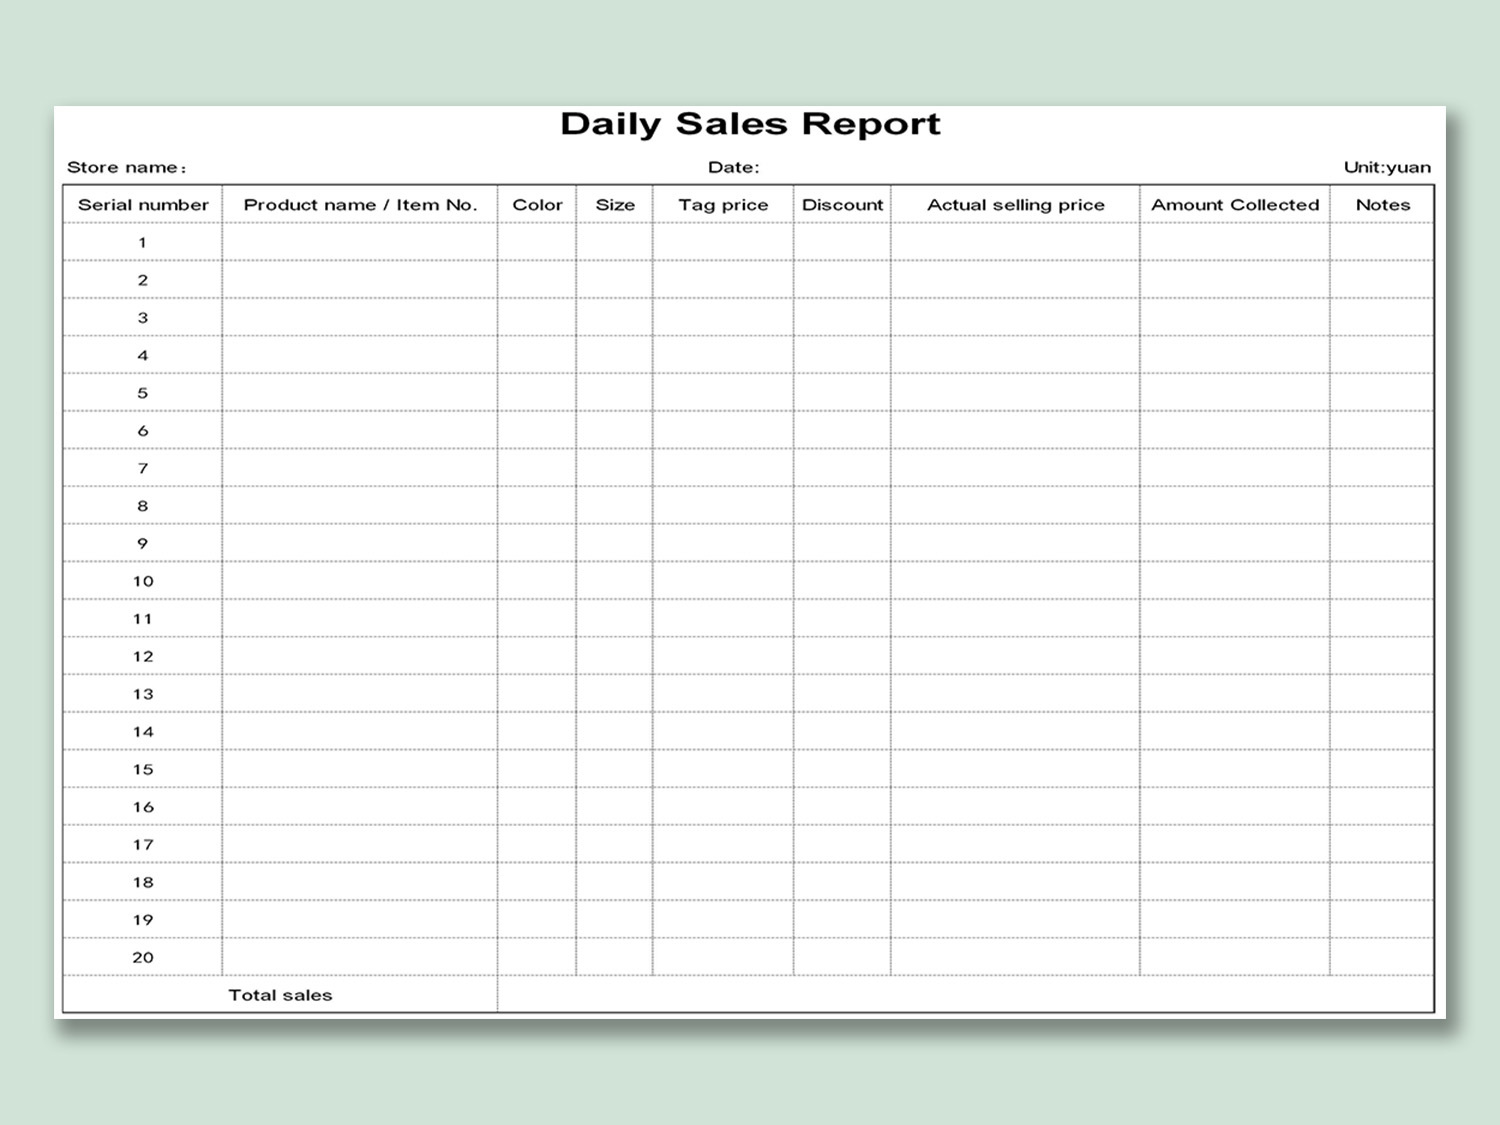
Sales reporting is a crucial aspect of any business, providing valuable insights into sales performance, customer behavior, and market trends. It helps sales teams identify strengths, weaknesses, and opportunities for improvement. However, creating a comprehensive and well-structured salesman report can be a challenging task for many sales professionals.
In this article, we will explore the importance of sales reporting, discuss the key elements that should be included in a salesman report template, and provide valuable insights and tips for creating an effective report. Whether you are a sales manager looking to improve your team’s reporting or a salesperson aiming to enhance your own performance, this guide will equip you with the knowledge and tools necessary to create impactful salesman reports.
The Importance of Sales Reporting
Effective sales reporting plays a pivotal role in driving business growth and success. It enables sales teams to monitor their progress, make data-driven decisions, and identify areas for improvement. Here are some key reasons why sales reporting is essential:
- Performance Evaluation: Sales reports provide a clear overview of individual and team performance, helping managers evaluate salespeople’s achievements against set targets and key performance indicators (KPIs).
- Identifying Trends: Sales reports allow businesses to identify market trends, customer preferences, and buying patterns. These insights can help companies align their sales strategies to maximize revenue and customer satisfaction.
- Tracking Sales Funnel: Sales reports enable organizations to track the progress of prospects through the sales funnel, identifying bottlenecks and areas where leads may be dropping off.
- Forecasting: By analyzing historical sales data, sales reports facilitate accurate sales forecasting, allowing businesses to set realistic targets and allocate resources effectively.
- Effective Communication: Sales reports provide a platform for effective communication between sales teams, managers, and other stakeholders. They help align everyone’s understanding of sales performance and goals.
The Key Elements of a Salesman Report Template
A well-structured salesman report template should include specific elements that provide a comprehensive overview of sales performance. Here are the key elements to consider:
1. Executive Summary
The executive summary is a concise overview of the sales report, highlighting the most critical insights and key performance metrics. It should provide a snapshot of the sales performance and any significant achievements or challenges.
2. Introduction
The introduction section sets the context for the report, outlining the purpose and scope. It should briefly explain the period covered by the report and any specific objectives or goals.
3. Sales Performance Metrics
This section focuses on key performance metrics that indicate sales performance, such as total revenue, number of deals closed, average deal size, conversion rates, and sales growth compared to previous periods. Including visual representations of these metrics, such as graphs or charts, can enhance understanding and clarity.
4. Sales Activities and Pipeline
Here, you should provide an overview of the sales activities and pipeline. This includes the number of leads generated, opportunities created, meetings held, and deals in various stages of the sales process. It helps assess the sales team’s productivity and identify potential bottlenecks.
5. Customer Analysis
Analyze customer data to gain insights into customer behavior, preferences, and buying patterns. Include information such as customer demographics, customer acquisition cost (CAC), customer lifetime value (CLV), and customer satisfaction scores. This analysis helps identify target customer segments and refine sales strategies accordingly.
6. Competitor Analysis
Assessing the competitive landscape is crucial for sales success. Include a section that analyzes competitors’ strengths, weaknesses, market share, and pricing strategies. This analysis can help identify areas where your organization can differentiate and gain a competitive edge.
7. Sales Team Performance
Evaluate individual and team performance against set targets and KPIs. Include metrics such as sales quota attainment, win rate, average deal cycle time, and customer retention rate. Recognize top performers and identify areas where additional training or support may be needed.
8. Challenges and Recommendations
Highlight any challenges or obstacles faced during the reporting period and provide recommendations for improvement. This section should address strategies to overcome challenges, enhance sales productivity, and capitalize on opportunities.
9. Conclusion
The conclusion section summarizes the key findings of the report and reinforces the main insights. It should provide a clear call-to-action or next steps based on the analysis.
Tips for Creating an Effective Salesman Report Template
Creating an effective salesman report template requires careful planning and attention to detail. Here are some tips to ensure your reports are informative and impactful:
1. Define Clear Objectives
Clearly define the objectives of your sales report to ensure it aligns with your organization’s goals. This will help you focus on the most relevant metrics and insights.
2. Use Visuals
Visual representations of data, such as graphs, charts, or infographics, can enhance understanding and make the report more engaging. Choose visuals that effectively communicate the information you want to convey.
3. Provide Context
Include contextual information to help readers understand the data. Explain any changes in sales strategies, market conditions, or external factors that may have influenced the results.
4. Keep it Concise
Avoid overwhelming readers with excessive information. Focus on the most critical insights and use concise language to convey your message effectively.
5. Include Actionable Recommendations
Provide actionable recommendations based on the analysis. These recommendations should be practical and specific, guiding sales teams on how to improve performance and overcome challenges.
6. Use Real-life Examples
Support your points with real-life examples, case studies, or success stories. This adds credibility to your report and helps readers understand the practical application of the insights.
7. Update Regularly
Sales reports should be updated regularly to ensure the data is current and relevant. Set a consistent reporting schedule to maintain the momentum and track progress over time.
Conclusion
Effective sales reporting is essential for driving business growth and success. A well-structured salesman report template provides valuable insights into sales performance, customer behavior, and market trends. By including key elements such as executive summary, sales performance metrics, customer analysis, and recommendations, sales reports enable organizations to make data-driven decisions and optimize sales strategies.
Remember to define clear objectives, use visuals to enhance understanding, provide context, and keep the report concise. Incorporate real-life examples and update the report regularly to ensure its relevance. By following these guidelines, you can create compelling and impactful salesman reports that drive sales excellence and contribute to overall business success.
FAQs After The Conclusion
1. How often should sales reports be generated?
Sales reports should be generated regularly to track performance and monitor progress. The frequency may vary depending on the organization’s needs, but weekly, monthly, and quarterly reports are common.
2. What are some common challenges in sales reporting?
Common challenges in sales reporting include data accuracy and reliability, data integration from multiple sources, interpreting the data effectively, and ensuring the report is actionable and relevant.
3. How can sales reports help in sales forecasting?
Sales reports provide historical sales data that can be analyzed to identify trends, patterns, and seasonality. This analysis helps in making accurate sales forecasts, enabling businesses to set realistic targets and allocate resources effectively.
4. What are some key performance indicators (KPIs) to include in sales reports?
Key performance indicators (KPIs) to include in sales reports can vary depending on the organization and industry. Some common KPIs include total revenue, conversion rate, average deal size, customer acquisition cost (CAC), and customer lifetime value (CLV).
5. How can sales reports be used to improve sales team performance?
Sales reports provide insights into individual and team performance, highlighting areas of strength and areas for improvement. By analyzing the data, sales managers can identify training needs, set realistic targets, and provide targeted coaching to enhance sales team performance.
Summary
Sales reporting is crucial for businesses to evaluate performance, track progress, and make data-driven decisions. A comprehensive salesman report template should include an executive summary, introduction, sales performance metrics, sales activities and pipeline, customer analysis, competitor analysis, sales team performance, challenges and recommendations, and a conclusion. By following best practices, such as defining clear objectives, using visuals, providing context, and updating regularly, sales professionals can create impactful reports that drive sales excellence and contribute to overall business success.


